data visualisation web portal (runs faster with Google Chrome)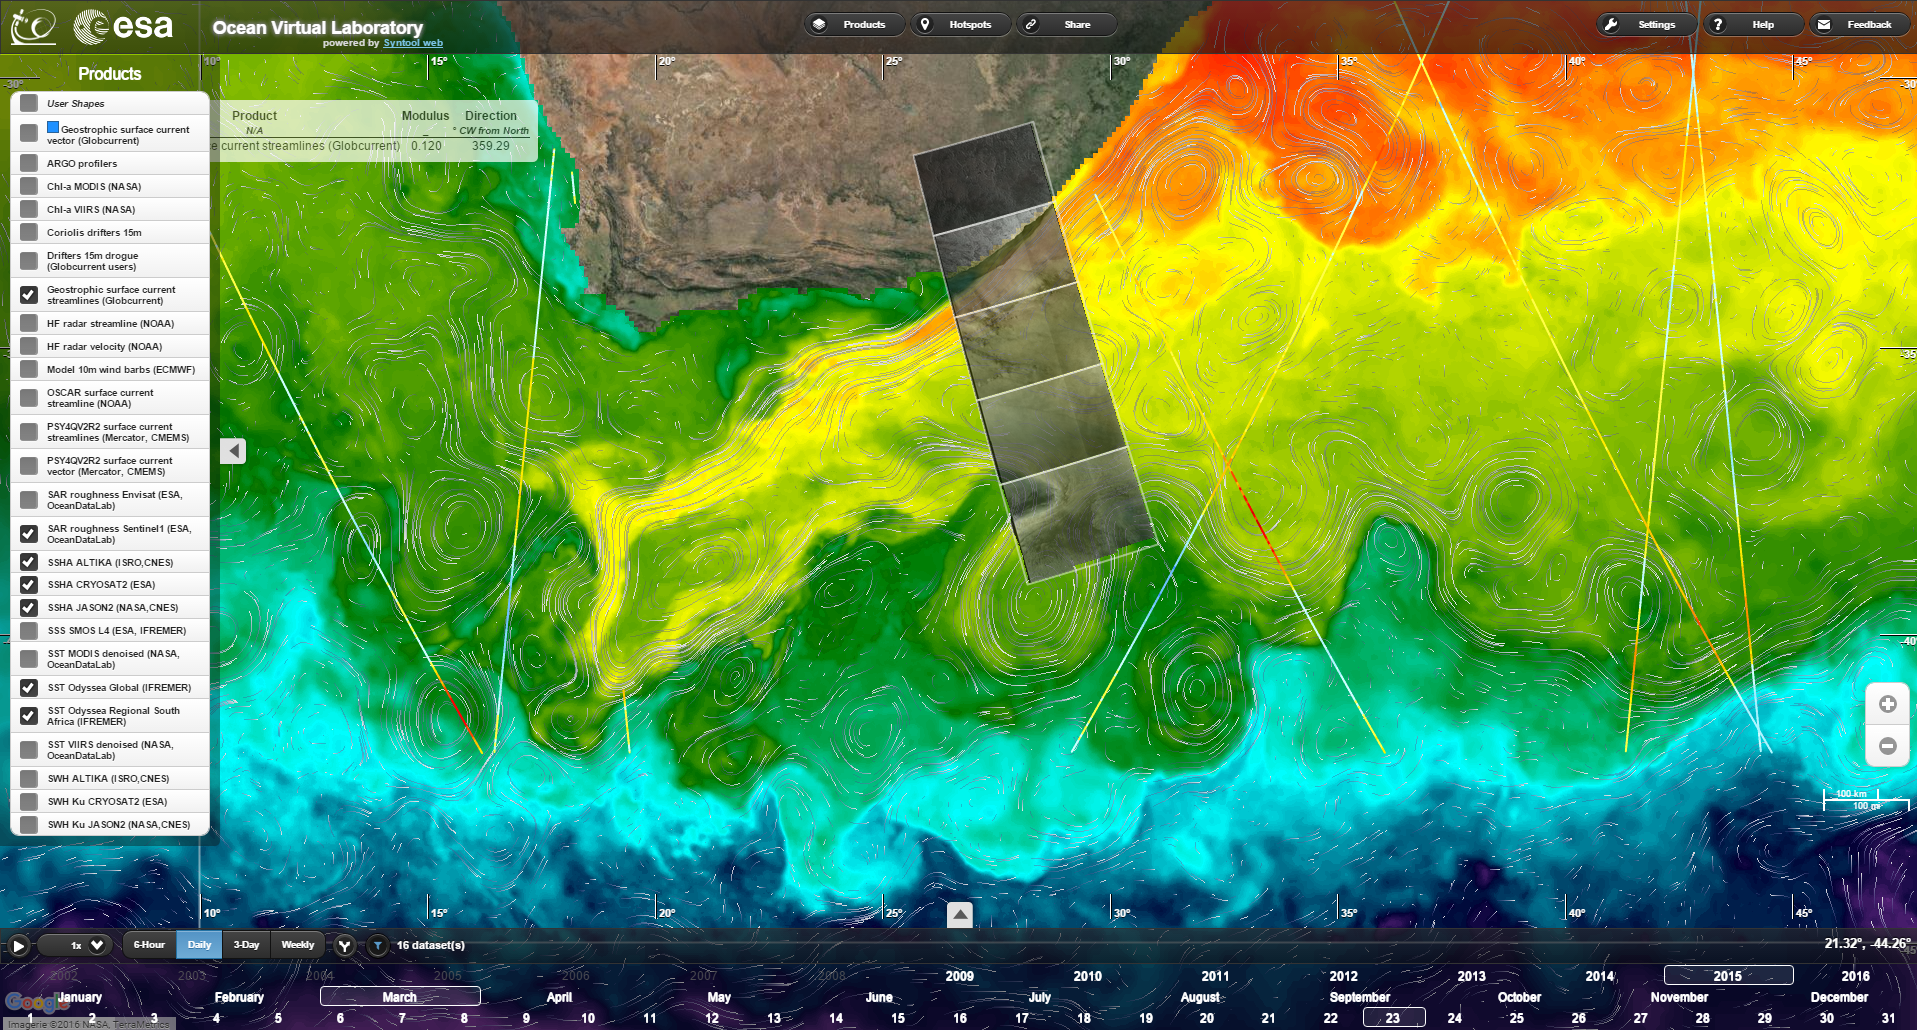

Table of contents
Summary
The Ocean Virtual Laboratory is funded by the European Space Agency under SEOM program. The main objective of the project is to develop a virtual platform to allow oceanographers to discover the existence and then to handle jointly, in a convenient, flexible and intuitive way, the various co-located EO datasets and related model/in-situ datasets over dedicated regions of interest with a different multifacet point of view. This is first demonstrated over the Agulhas region.Developed tools shall foster the emergence of new methods prototype and products making use of the complementarity between sensors to study ocean related processes. The tool shall also provide the best possible visibility on the upcoming Sentinel1/2/3 datatakes to help plan and coordinate with field campaign.
The OVL is filling the gap between Space agencies data portals that distributes specific EO data and analysis software like IDL/ENVI or Matlab that are more suitable for in-depth analysis of a given dataset. A few GIS systems such as Google Earth are able to import several data layers but very little interaction with data (apart for basic layer transparency) is possible.
The project scientific committee has to ensure that the developed OVL is providing significant added value and is not duplicating existing efforts in the international community. Scientists in the consortium shall ensure that OVL is built for scientists and with a large beta-tester community and response effectiveness to satisfy most needs of a rather versatile community.
Outcome of the project
The Web Client is available : the user can visualize remote sensing and in-situ data. Its development is fully operational : it is evolving with users needs. Try and play with the tool. Users feedback is welcome.The Standalone Client is also available !. Users are able to visualize and also interact with the software and some data packages are provided as tar balls for some dedicated case studies. Try and play with the tool. Users feedback is welcome.
We released some YouTube videos (you can see the full playlist) to demonstrate how the web and standalone OVL applications can be used to find interesting cases of synergy between various sensors and data sources
Other tutorial YouTube videos where released at the occasion of international events in the last years :
EGU 2019 playlist
EGU 2020 playlist
ESA Φ-WEEK 2021 playlist
Partners
 OceanDataLab (Locmaria-Plouzané, France)
 IFREMER (Plouzané, France)
 NERSC (Bergen, Norway)
 UPT (Timisoara, Romania)
 IOPAN (Sopot, Poland)
 PML (Plymouth, UK)
Project status
The Ocean Virtual Laboratory Project has started on October 2014, and has ended in March 2017. The OVL-NG project is running since then, to continue the tools support, maintenance and update.Main Milestones
Ocean Virtual Laboratory has been presented at the following events :- 3rd Summer school on Ocean Remote Sensing Synergy - 20-24 June 2016, Moulin-Mer (Logonna Daoulas, France). You can find more information on the Summer School website : http://conferences.telecom-bretagne.eu/synergy_summer_school_2016
- 2nd training course on Ocean Remote Sensing Synergy, 25-26 October 2016, UPT, Timisoara, Romania. Download the flyer of the trainig course. Students wishing to participate can apply by clicking here or by filling this form and sending it to training-course-timisoara-2016nobotplease oceandatalab.com Venue: Université Politehnica Timișoara Piata Victoriei nr. 2, Timișoara 300006, Romania Phone: (+40) 256 403 000
The OVL project is funded by  the European Space Agency
 the European Space Agency
The OVL-NG project is supported by  ESA Network of Resources Initiative
 ESA Network of Resources Initiative